Botswana


Introduction
Background
Seeking to stop the incorporation of their land into Rhodesia (Zimbabwe) or the Union of South Africa, in 1885, three tribal chiefs traveled to Great Britain and successfully lobbied the British Government to put "Bechuanaland" under UK protection. Upon independence in 1966, the British protectorate of Bechuanaland adopted the new name of Botswana. More than five decades of uninterrupted civilian leadership, progressive social policies, and significant capital investment have created one of the most stable economies in Africa. The ruling Botswana Democratic Party has won every national election since independence; President Mokgweetsi Eric MASISI assumed the presidency in April 2018 following the retirement of former President Ian KHAMA due to constitutional term limits. MASISI won his first election as president in October 2019, and he is Botswana’s fifth president since independence. Mineral extraction, principally diamond mining, dominates economic activity, though tourism is a growing sector due to the country's conservation practices and extensive nature preserves. Botswana has one of the world's highest rates of HIV/AIDS infection, but also one of Africa's most progressive and comprehensive programs for dealing with the disease.
Visit the Definitions and Notes page to view a description of each topic.
Geography
Location
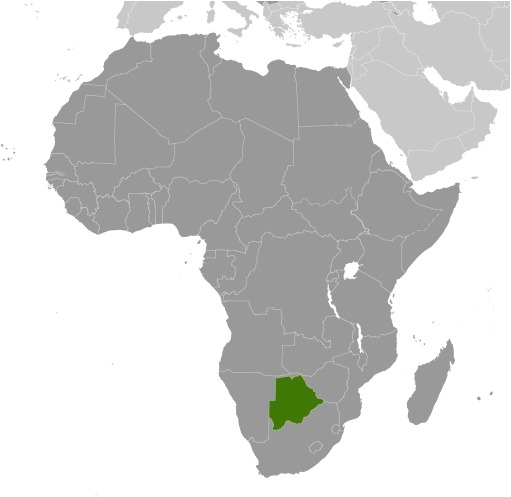
Southern Africa, north of South Africa
Geographic coordinates
22 00 S, 24 00 E
Map references
Africa

Land boundaries
total: 4,347.15 km
border countries (4): Namibia 1544 km, South Africa 1969 km, Zambia 0.15 km, Zimbabwe 834 km
Coastline
0 km (landlocked)
Maritime claims
none (landlocked)
Climate
semiarid; warm winters and hot summers
Terrain
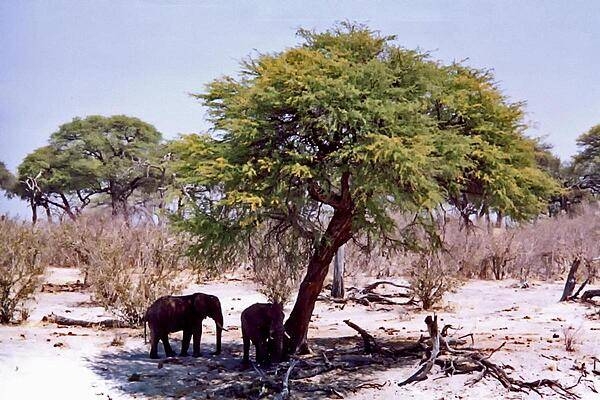
predominantly flat to gently rolling tableland; Kalahari Desert in southwest
Elevation
highest point: Tsodilo Hills 1,489 m
lowest point: junction of the Limpopo and Shashe Rivers 513 m
mean elevation: 1,013 m
Natural resources
diamonds, copper, nickel, salt, soda ash, potash, coal, iron ore, silver
Land use
agricultural land: 45.8% (2018 est.)
arable land: 0.6% (2018 est.)
permanent crops: 0% (2018 est.)
permanent pasture: 45.2% (2018 est.)
forest: 19.8% (2018 est.)
other: 34.4% (2018 est.)
Irrigated land
20 sq km (2012)
Major watersheds (area sq km)
Atlantic Ocean drainage: Orange (941,351 sq km)
Indian Ocean drainage: Zambezi (1,332,412 sq km)
Internal (endorheic basin) drainage: Okavango Basin (863,866 sq km)
Major aquifers
Lower Kalahari-Stampriet Basin, Upper Kalahari-Cuvelai-Upper Zambezi Basin
Major rivers (by length in km)
Zambezi (shared with Zambia [s]), Angola, Namibia, Zimbabwe, and Mozambique [m]) - 2,740 km; Limpopo (shared with South Africa [s], Zimbabwe, and Mozambique [m]) - 1,800 km; Okavango river mouth (shared with Angola [s], and Namibia) - 1,600 km
note – [s] after country name indicates river source; [m] after country name indicates river mouth
Population distribution
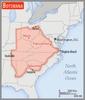
the population is primarily concentrated in the east with a focus in and around the captial of Gaborone, and the far central-eastern city of Francistown; population density remains low in other areas in the country, especially in the Kalahari to the west as shown in this population distribution map
Natural hazards
periodic droughts; seasonal August winds blow from the west, carrying sand and dust across the country, which can obscure visibility
Geography - note
landlocked; population concentrated in the southern and eastern parts of the country
People and Society
Population
2,350,667 (July 2021 est.)
note: estimates for this country explicitly take into account the effects of excess mortality due to AIDS; this can result in lower life expectancy, higher infant mortality, higher death rates, lower population growth rates, and changes in the distribution of population by age and sex than would otherwise be expected
Nationality
noun: Motswana (singular), Batswana (plural)
adjective: Motswana (singular), Batswana (plural)
Ethnic groups
Tswana (or Setswana) 79%, Kalanga 11%, Basarwa 3%, other, including Kgalagadi and people of European ancestry 7%
Languages
Setswana 77.3%, Sekalanga 7.4%, Shekgalagadi 3.4%, English (official) 2.8%, Zezuru/Shona 2%, Sesarwa 1.7%, Sembukushu 1.6%, Ndebele 1%, other 2.8% (2011 est.)
Religions
Christian 79.1%, Badimo 4.1%, other 1.4% (includes Baha'i, Hindu, Muslim, Rastafarian), none 15.2%, unspecified 0.3% (2011 est.)
Demographic profile
Botswana has experienced one of the most rapid declines in fertility in Sub-Saharan Africa. The total fertility rate has fallen from more than 5 children per woman in the mid 1980s to approximately 2.4 in 2013. The fertility reduction has been attributed to a host of factors, including higher educational attainment among women, greater participation of women in the workforce, increased contraceptive use, later first births, and a strong national family planning program. Botswana was making significant progress in several health indicators, including life expectancy and infant and child mortality rates, until being devastated by the HIV/AIDs epidemic in the 1990s.
Today Botswana has the third highest HIV/AIDS prevalence rate in the world at approximately 22%, however comprehensive and effective treatment programs have reduced HIV/AIDS-related deaths. The combination of declining fertility and increasing mortality rates because of HIV/AIDS is slowing the population aging process, with a narrowing of the youngest age groups and little expansion of the oldest age groups. Nevertheless, having the bulk of its population (about 60%) of working age will only yield economic benefits if the labor force is healthy, educated, and productively employed.
Batswana have been working as contract miners in South Africa since the 19th century. Although Botswana’s economy improved shortly after independence in 1966 with the discovery of diamonds and other minerals, its lingering high poverty rate and lack of job opportunities continued to push workers to seek mining work in southern African countries. In the early 1970s, about a third of Botswana’s male labor force worked in South Africa (lesser numbers went to Namibia and Zimbabwe). Not until the 1980s and 1990s, when South African mining companies had reduced their recruitment of foreign workers and Botswana’s economic prospects had improved, were Batswana increasingly able to find job opportunities at home.
Most Batswana prefer life in their home country and choose cross-border migration on a temporary basis only for work, shopping, visiting family, or tourism. Since the 1970s, Botswana has pursued an open migration policy enabling it to recruit thousands of foreign workers to fill skilled labor shortages. In the late 1990s, Botswana’s prosperity and political stability attracted not only skilled workers but small numbers of refugees from neighboring Angola, Namibia, and Zimbabwe.
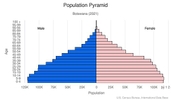
Age structure
0-14 years: 30.54% (male 357,065/female 350,550)
15-24 years: 18.31% (male 208,824/female 215,462)
25-54 years: 39.67% (male 434,258/female 484,922)
55-64 years: 5.92% (male 59,399/female 77,886)
65 years and over: 5.56% (male 53,708/female 75,159) (2020 est.)

Dependency ratios
total dependency ratio: 61.1
youth dependency ratio: 53.8
elderly dependency ratio: 7.3
potential support ratio: 13.8 (2020 est.)
Median age
total: 25.7 years
male: 24.5 years
female: 26.7 years (2020 est.)
Population distribution
the population is primarily concentrated in the east with a focus in and around the captial of Gaborone, and the far central-eastern city of Francistown; population density remains low in other areas in the country, especially in the Kalahari to the west as shown in this population distribution map
Urbanization
urban population: 71.6% of total population (2021)
rate of urbanization: 2.47% annual rate of change (2020-25 est.)
Major urban areas - population
269,000 GABORONE (capital) (2018)
Sex ratio
at birth: 1.03 male(s)/female
0-14 years: 1.02 male(s)/female
15-24 years: 0.97 male(s)/female
25-54 years: 0.9 male(s)/female
55-64 years: 0.76 male(s)/female
65 years and over: 0.71 male(s)/female
total population: 0.93 male(s)/female (2020 est.)
Maternal mortality ratio
144 deaths/100,000 live births (2017 est.)
country comparison to the world: 59Infant mortality rate
total: 25.97 deaths/1,000 live births
male: 28.38 deaths/1,000 live births
female: 23.49 deaths/1,000 live births (2021 est.)
Life expectancy at birth
total population: 65.24 years
male: 63.21 years
female: 67.32 years (2021 est.)
Contraceptive prevalence rate
67.4% (2017)
Drinking water source
improved: urban: 98.2% of population
rural: 94% of population
total: 96.9% of population
unimproved: urban: 1.8% of population
rural: 3.1% of population
total: 3.8% of population (2017 est.)
Current Health Expenditure
5.9% (2018)
Physicians density
0.53 physicians/1,000 population (2016)
Hospital bed density
1.8 beds/1,000 population
Sanitation facility access
improved: urban: 92.9% of population
rural: 60.8% of population
total: 82.8% of population
unimproved: urban: 7.1% of population
rural: 39.2% of population
total: 17.2% of population (2017 est.)
Major infectious diseases
degree of risk: high (2020)
food or waterborne diseases: bacterial diarrhea, hepatitis A, and typhoid fever
vectorborne diseases: malaria
Literacy
definition: age 15 and over can read and write
total population: 88.5%
male: 88%
female: 88.9% (2015)
School life expectancy (primary to tertiary education)
total: 13 years
male: 13 years
female: 13 years (2013)
Unemployment, youth ages 15-24
total: 46.2%
male: 44.9%
female: 47.8% (2020 est.)
Environment
Environment - current issues
overgrazing; desertification; limited freshwater resources; air pollution
Environment - international agreements
party to: Biodiversity, Climate Change, Climate Change-Kyoto Protocol, Climate Change-Paris Agreement, Desertification, Endangered Species, Hazardous Wastes, Law of the Sea, Nuclear Test Ban, Ozone Layer Protection, Wetlands
signed, but not ratified: none of the selected agreements
Air pollutants
particulate matter emissions: 21.24 micrograms per cubic meter (2016 est.)
carbon dioxide emissions: 6.34 megatons (2016 est.)
methane emissions: 5.73 megatons (2020 est.)
Climate
semiarid; warm winters and hot summers
Land use
agricultural land: 45.8% (2018 est.)
arable land: 0.6% (2018 est.)
permanent crops: 0% (2018 est.)
permanent pasture: 45.2% (2018 est.)
forest: 19.8% (2018 est.)
other: 34.4% (2018 est.)
Urbanization
urban population: 71.6% of total population (2021)
rate of urbanization: 2.47% annual rate of change (2020-25 est.)
Revenue from forest resources
forest revenues: 0.23% of GDP (2018 est.)
country comparison to the world: 88Major infectious diseases
degree of risk: high (2020)
food or waterborne diseases: bacterial diarrhea, hepatitis A, and typhoid fever
vectorborne diseases: malaria
Waste and recycling
municipal solid waste generated annually: 210,854 tons (2010 est.)
municipal solid waste recycled annually: 2,109 tons (2005 est.)
percent of municipal solid waste recycled: 1% (2005 est.)
Major rivers (by length in km)
Zambezi (shared with Zambia [s]), Angola, Namibia, Zimbabwe, and Mozambique [m]) - 2,740 km; Limpopo (shared with South Africa [s], Zimbabwe, and Mozambique [m]) - 1,800 km; Okavango river mouth (shared with Angola [s], and Namibia) - 1,600 km
note – [s] after country name indicates river source; [m] after country name indicates river mouth
Major watersheds (area sq km)
Atlantic Ocean drainage: Orange (941,351 sq km)
Indian Ocean drainage: Zambezi (1,332,412 sq km)
Internal (endorheic basin) drainage: Okavango Basin (863,866 sq km)
Major aquifers
Lower Kalahari-Stampriet Basin, Upper Kalahari-Cuvelai-Upper Zambezi Basin
Total water withdrawal
municipal: 100.6 million cubic meters (2017 est.)
industrial: 23.4 million cubic meters (2017 est.)
agricultural: 69 million cubic meters (2017 est.)
Total renewable water resources
12.24 billion cubic meters (2017 est.)
Government
Country name
conventional long form: Republic of Botswana
conventional short form: Botswana
local long form: Republic of Botswana
local short form: Botswana
former: Bechuanaland
etymology: the name Botswana means "Land of the Tswana" - referring to the country's major ethnic group
Government type
parliamentary republic
Capital
name: Gaborone
geographic coordinates: 24 38 S, 25 54 E
time difference: UTC+2 (7 hours ahead of Washington, DC, during Standard Time)
etymology: named after GABORONE (ca. 1825-1931), a revered kgosi (chief) of the Tlokwa tribe, part of the larger Tswana ethnic group
Administrative divisions
10 districts and 6 town councils*; Central, Chobe, Francistown*, Gaborone*, Ghanzi, Jwaneng*, Kgalagadi, Kgatleng, Kweneng, Lobatse*, North East, North West, Selebi-Phikwe*, South East, Southern, Sowa Town*
Independence
30 September 1966 (from the UK)
National holiday
Independence Day (Botswana Day), 30 September (1966)
Constitution
history: previous 1960 (preindependence); latest adopted March 1965, effective 30 September 1966
amendments: proposed by the National Assembly; passage requires approval in two successive Assembly votes with at least two-thirds majority in the final vote; proposals to amend constitutional provisions on fundamental rights and freedoms, the structure and branches of government, and public services also requires approval by majority vote in a referendum and assent by the president of the republic; amended several times, last in 2016
Legal system
mixed legal system of civil law influenced by the Roman-Dutch model and also customary and common law
International law organization participation
accepts compulsory ICJ jurisdiction with reservations; accepts ICCt jurisdiction
Citizenship
citizenship by birth: no
citizenship by descent only: at least one parent must be a citizen of Botswana
dual citizenship recognized: no
residency requirement for naturalization: 10 years
Suffrage
18 years of age; universal
Executive branch
chief of state: President Mokgweetse Eric MASISI (since 1 April 2018); Vice President Slumber TSOGWANE (since 4 April 2018); note - the president is both chief of state and head of government
head of government: President Mokgweetse Eric MASISI (since 1 April 2018); Vice President Slumber TSOGWANE (since 4 April 2018); note - the president is both chief of state and head of government
cabinet: Cabinet appointed by the president
elections/appointments: president indirectly elected by the National Assembly for a 5-year term (eligible for a second term); election last held on 24 October 2014 (next to be held on 31 October 2019); vice president appointed by the president
election results: President Seretse Khama Ian KHAMA (since 1 April 2008) stepped down on 1 April 2018 having completed the constitutionally mandated 10-year term limit; upon his retirement, then Vice President MASISI became president; national elections held on 23 October 2019 gave MASISI'S BPD 38 seats in the National Assembly which then selected MASISI as President
Legislative branch
description: unicameral Parliament consists of the National Assembly (63 seats; 57 members directly elected in single-seat constituencies by simple majority vote, 4 nominated by the president and indirectly elected by simple majority vote by the rest of the National Assembly, and 2 ex-officio members - the president and attorney general; elected members serve 5-year terms); note - the House of Chiefs (Ntlo ya Dikgosi), an advisory body to the National Assembly, consists of 35 members - 8 hereditary chiefs from Botswana's principal tribes, 22 indirectly elected by the chiefs, and 5 appointed by the president; the House of Chiefs consults on issues including powers of chiefs, customary courts, customary law, tribal property, and constitutional amendments
elections: last held on 23 October 2019 (next to be held in October 2024)
election results: percent of vote by party - BDP 52.7%, UDC 35.9%, BPF 4.4%, AP 5.1%, other 1.7%; seats by party - BDP 38, UDC 15, BPF 3, AP 1; composition - NA
Judicial branch
highest courts: Court of Appeal, High Court (each consists of a chief justice and a number of other judges as prescribed by the Parliament)
judge selection and term of office: Court of Appeal and High Court chief justices appointed by the president and other judges appointed by the president upon the advice of the Judicial Service Commission; all judges appointed to serve until age 70
subordinate courts: Industrial Court (with circuits scheduled monthly in the capital city and in 3 districts); Magistrates Courts (1 in each district); Customary Court of Appeal; Paramount Chief's Court/Urban Customary Court; Senior Chief's Representative Court; Chief's Representative’s Court; Headman's Court
Political parties and leaders
Alliance of Progressives or AP [Ndaba GAOLATHE]
Botswana Congress Party or BCP [Dumelang SALESHANDO]
Botswana Democratic Party or BDP [Mokgweetsi MASISI]
Botswana Movement for Democracy or BMD [Sidney PILANE]
Botswana National Front or BNF [Duma BOKO]
Botswana Patriotic Front or BPF [Biggie BUTALE]
Botswana Peoples Party or BPP [Motlatsi MOLAPISI]
Real Alternative Party or RAP [Gaontebale MOKGOSI]
Umbrella for Democratic Change or UDC [Duma BOKO] (various times the collation has included the BMD, BPP, BCP and BNF) (2019)
International organization participation
ACP, AfDB, AU, C, CD, FAO, G-77, IAEA, IBRD, ICAO, ICCt, ICRM, IDA, IFAD, IFC, IFRCS, ILO, IMF, Interpol, IOC, IOM, IPU, ISO, ITSO, ITU, ITUC (NGOs), MIGA, NAM, OPCW, SACU, SADC, UN, UNCTAD, UNESCO, UNIDO, UNWTO, UPU, WCO, WFTU (NGOs), WHO, WIPO, WMO, WTO
Diplomatic representation in the US
chief of mission: Ambassador Onkokame Kitso MOKAILA (since 17 September 2020)
chancery: 1531-1533 New Hampshire Avenue NW, Washington, DC 20036
telephone: [1] (202) 244-4990
FAX: [1] (202) 244-4164
email address and website:
info@botswanaembassy.org
http://www.botswanaembassy.org/
consulate(s) general: Atlanta
Diplomatic representation from the US
chief of mission: Ambassador Craig Lewis CLOUD (since 2 April 2019)
embassy: Embassy Drive, Government Enclave (off Khama Crescent), Gaborone
mailing address: 2170 Gabarone Place, Washington DC 20521-2170
telephone: [267] 395-3982
FAX: [267] 318-0232
email address and website:
ConsularGabarone@state.gov
https://bw.usembassy.gov/
Flag description
light blue with a horizontal white-edged black stripe in the center; the blue symbolizes water in the form of rain, while the black and white bands represent racial harmony
National symbol(s)
zebra; national colors: blue, white, black
National anthem
name: "Fatshe leno la rona" (Our Land)
lyrics/music: Kgalemang Tumedisco MOTSETE
note: adopted 1966
Economy
Economic overview
Until the beginning of the global recession in 2008, Botswana maintained one of the world's highest economic growth rates since its independence in 1966. Botswana recovered from the global recession in 2010, but only grew modestly until 2017, primarily due to a downturn in the global diamond market, though water and power shortages also played a role. Through fiscal discipline and sound management, Botswana has transformed itself from one of the poorest countries in the world five decades ago into a middle-income country with a per capita GDP of approximately $18,100 in 2017. Botswana also ranks as one of the least corrupt and best places to do business in Sub-Saharan Africa.
Because of its heavy reliance on diamond exports, Botswana’s economy closely follows global price trends for that one commodity. Diamond mining fueled much of Botswana’s past economic expansion and currently accounts for one-quarter of GDP, approximately 85% of export earnings, and about one-third of the government's revenues. In 2017, Diamond exports increased to the highest levels since 2013 at about 22 million carats of output, driving Botswana’s economic growth to about 4.5% and increasing foreign exchange reserves to about 45% of GDP. De Beers, a major international diamond company, signed a 10-year deal with Botswana in 2012 and moved its rough stone sorting and trading division from London to Gaborone in 2013. The move was geared to support the development of Botswana's nascent downstream diamond industry.
Tourism is a secondary earner of foreign exchange and many Batswana engage in tourism-related services, subsistence farming, and cattle rearing. According to official government statistics, unemployment is around 20%, but unofficial estimates run much higher. The prevalence of HIV/AIDS is second highest in the world and threatens the country's impressive economic gains.
Real GDP (purchasing power parity)
$37.72 billion note: data are in 2017 dollars (2020 est.)
$40.95 billion note: data are in 2017 dollars (2019 est.)
$39.75 billion note: data are in 2017 dollars (2018 est.)
note: data are in 2017 dollars
Real GDP growth rate
2.4% (2017 est.)
4.3% (2016 est.)
-1.7% (2015 est.)
Real GDP per capita
$16,000 note: data are in 2017 dollars (2020 est.)
$17,800 note: data are in 2017 dollars (2019 est.)
$17,600 note: data are in 2017 dollars (2018 est.)
note: data are in 2017 dollars
GDP (official exchange rate)
$18.335 billion (2019 est.)
Inflation rate (consumer prices)
2.7% (2019 est.)
3.2% (2018 est.)
3.2% (2017 est.)
Credit ratings
Moody's rating: A2 (2020)
Standard & Poors rating: BBB+ (2020)
GDP - composition, by sector of origin
agriculture: 1.8% (2017 est.)
industry: 27.5% (2017 est.)
services: 70.6% (2017 est.)
GDP - composition, by end use
household consumption: 48.5% (2017 est.)
government consumption: 18.4% (2017 est.)
investment in fixed capital: 29% (2017 est.)
investment in inventories: -1.8% (2017 est.)
exports of goods and services: 39.8% (2017 est.)
imports of goods and services: -33.9% (2017 est.)
Agricultural products
milk, roots/tubers, vegetables, sorghum, beef, game meat, watermelons, cabbages, goat milk, onions
Industries
diamonds, copper, nickel, salt, soda ash, potash, coal, iron ore, silver; beef processing; textiles
Labor force - by occupation
agriculture: NA
industry: NA
services: NA
Population below poverty line
19.3% (2009 est.)
Gini Index coefficient - distribution of family income
53.3 (2015 est.)
63 (1993)
Household income or consumption by percentage share
lowest 10%: NA
highest 10%: NA
Budget
revenues: 5.305 billion (2017 est.)
expenditures: 5.478 billion (2017 est.)
Fiscal year
1 April - 31 March
Current account balance
$2.146 billion (2017 est.)
$2.147 billion (2016 est.)
Exports
$6.16 billion note: data are in current year dollars (2019 est.)
$7.53 billion note: data are in current year dollars (2018 est.)
Exports - partners
India 21%, Belgium 19%, United Arab Emirates 19%, South Africa 9%, Israel 7%, Hong Kong 6%, Singapore 5% (2019)
Exports - commodities
diamonds, insulated wiring, gold, beef, carbonates (2019)
Imports
$7.44 billion note: data are in current year dollars (2019 est.)
$7.31 billion note: data are in current year dollars (2018 est.)
Imports - partners
South Africa 58%, Namibia 9%, Canada 7% (2019)
Imports - commodities
diamonds, refined petroleum, cars, delivery trucks, electricity (2019)
Reserves of foreign exchange and gold
$7.491 billion (31 December 2017 est.)
$7.189 billion (31 December 2016 est.)
Debt - external
$2.187 billion (31 December 2017 est.)
$2.421 billion (31 December 2016 est.)
Exchange rates
pulas (BWP) per US dollar -
10.90512 (2020 est.)
10.81081 (2019 est.)
10.60446 (2018 est.)
10.1263 (2014 est.)
8.9761 (2013 est.)
Unemployment, youth ages 15-24
total: 46.2%
male: 44.9%
female: 47.8% (2020 est.)
Energy
Electricity access
electrification - total population: 59% (2019)
electrification - urban areas: 71% (2019)
electrification - rural areas: 29% (2019)
Electricity - installed generating capacity
735,000 kW (2016 est.)
country comparison to the world: 135Electricity - from fossil fuels
100% of total installed capacity (2016 est.)
country comparison to the world: 4Electricity - from nuclear fuels
0% of total installed capacity (2017 est.)
country comparison to the world: 54Electricity - from hydroelectric plants
0% of total installed capacity (2017 est.)
country comparison to the world: 159Electricity - from other renewable sources
0% of total installed capacity (2017 est.)
country comparison to the world: 177Refined petroleum products - consumption
21,000 bbl/day (2016 est.)
country comparison to the world: 135Communications
Telephones - fixed lines
total subscriptions: 142,587 (2020)
subscriptions per 100 inhabitants: 5.95 (2020 est.)
Telephones - mobile cellular
total subscriptions: 3,819,019 (2020)
subscriptions per 100 inhabitants: 162.4 (2020 est.)
Telecommunication systems
general assessment:
due to effective regulatory reform and active competition, Botswana’s telecom market is one of the most liberalized in the region; strategy to drive nationwide ICT penetration is slowed; one of the highest mobile penetration rates in Africa; operators developing 3G and LTE; Internet use rising due to lower prices; government has embraced digitalization, e-government and identity programs that require citizens to provide detailed personal information; previously dependent on satellites for international connectivity, country’s new submarine cable landings improved competition and tripled international Internet capacity; importer of broadcast equipment from Hong Kong and China (2020)
(2020)domestic: fixed-line teledensity has declined in recent years and now stands at roughly 6 telephones per 100 persons; mobile-cellular teledensity has advanced to 174 telephones per 100 persons (2019)
international: country code - 267; international calls are made via satellite, using international direct dialing; 2 international exchanges; digital microwave radio relay links to Namibia, Zambia, Zimbabwe, and South Africa; satellite earth station - 1 Intelsat (Indian Ocean)
note: the COVID-19 pandemic continues to have a significant impact on production and supply chains globally; since 2020, some aspects of the telecom sector have experienced downturn, particularly in mobile device production; many network operators delayed upgrades to infrastructure; progress towards 5G implementation was postponed or slowed in some countries; consumer spending on telecom services and devices was affected by large-scale job losses and the consequent restriction on disposable incomes; the crucial nature of telecom services as a tool for work and school from home became evident, and received some support from governments
Broadcast media
2 TV stations - 1 state-owned and 1 privately owned; privately owned satellite TV subscription service is available; 2 state-owned national radio stations; 4 privately owned radio stations broadcast locally (2019)
Internet users
total: 1.12 million (2021 est.)
percent of population: 47% (2019 est.)
Broadband - fixed subscriptions
total: 71,898 (2020)
subscriptions per 100 inhabitants: 3.06 (2020 est.)
Transportation
National air transport system
number of registered air carriers: 1 (2020)
inventory of registered aircraft operated by air carriers: 6
annual passenger traffic on registered air carriers: 253,417 (2018)
annual freight traffic on registered air carriers: 110,000 mt-km (2018)
Airports - with paved runways
total: 10
over 3,047 m: 2
2,438 to 3,047 m: 1
1,524 to 2,437 m: 6
914 to 1,523 m: 1 (2017)
Airports - with unpaved runways
total: 64
1,524 to 2,437 m: 5
914 to 1,523 m: 46
under 914 m: 13 (2013)
Railways
total: 888 km (2014)
narrow gauge: 888 km 1.067-m gauge (2014)
Roadways
total: 31,747 km (2017)
paved: 9,810 km (2017)
unpaved: 21,937 km (2017)
Military and Security
Military and security forces
Botswana Defense Force (BDF): Ground Forces Command, Air Arm Command, Defense Logistics Command (2021)
note - both the armed forces and the Botswana Police Service report to the Ministry of Defense, Justice, and Security
Military expenditures
3% of GDP (2020 est.)
2.8% of GDP (2019)
2.8% of GDP (2018)
3% of GDP (2017)
3.4% of GDP (2016)
Military and security service personnel strengths
the Botswana Defense Force (BDF) has approximately 9,000 active personnel (2021)
Military equipment inventories and acquisitions
the BDF has a mix of foreign-supplied and mostly older weapons and equipment, largely from Europe and the US; since 2010, France is the leading supplier of armaments to the BDF (2020)
Military service age and obligation
18 is the legal minimum age for voluntary military service; no conscription (2019)
Military - note
Bechuanaland/Botswana did not have a permanent military during colonial times, with the British colonial administrators relying instead on small, lightly armed constabularies such as the Bechuanaland Mounted Police, the Bechuanaland Border Police, and by the early 1960s, the Police Mobile Unit (PMU); after independence in 1966, Botswana militarized the PMU and gave it responsibility for the country’s defense rather than create a conventional military force; however, turmoil in neighboring countries and numerous cross-border incursions by Rhodesian and South African security forces demonstrated that the PMU was inadequate for defending the country and led to the establishment of the BDF in 1977; as of 2021, the BDF’s primary missions included securing territorial integrity/border security and internal duties such as disaster relief and anti-poaching
as of 2021, the Army was comprised of approximately 4 small combat brigades (2 infantry, 1 light armored, 1 artillery), while the Air Force had 1 fighter/ground attack squadron; Botswana has no navy, but the Army has a marine unit with boats and other river craft for patrolling the country’s numerous waterways, particularly the Chobe River and Okavango swamps
Botswana participates in the Southern African Development Community (SADC) Standby Force, and in 2021 contributed nearly 300 troops to the SADC’s effort to help the Mozambique Government suppress an insurgency