Introduction
Background
Several eastern Baltic tribes merged in medieval times to form the ethnic core of the Latvian people (ca. 8th-12th centuries A.D.). The region subsequently came under the control of Germans, Poles, Swedes, and finally Russians. Latvia reestablished its independence in 1991 after the breakup of the Soviet Union.
Geography
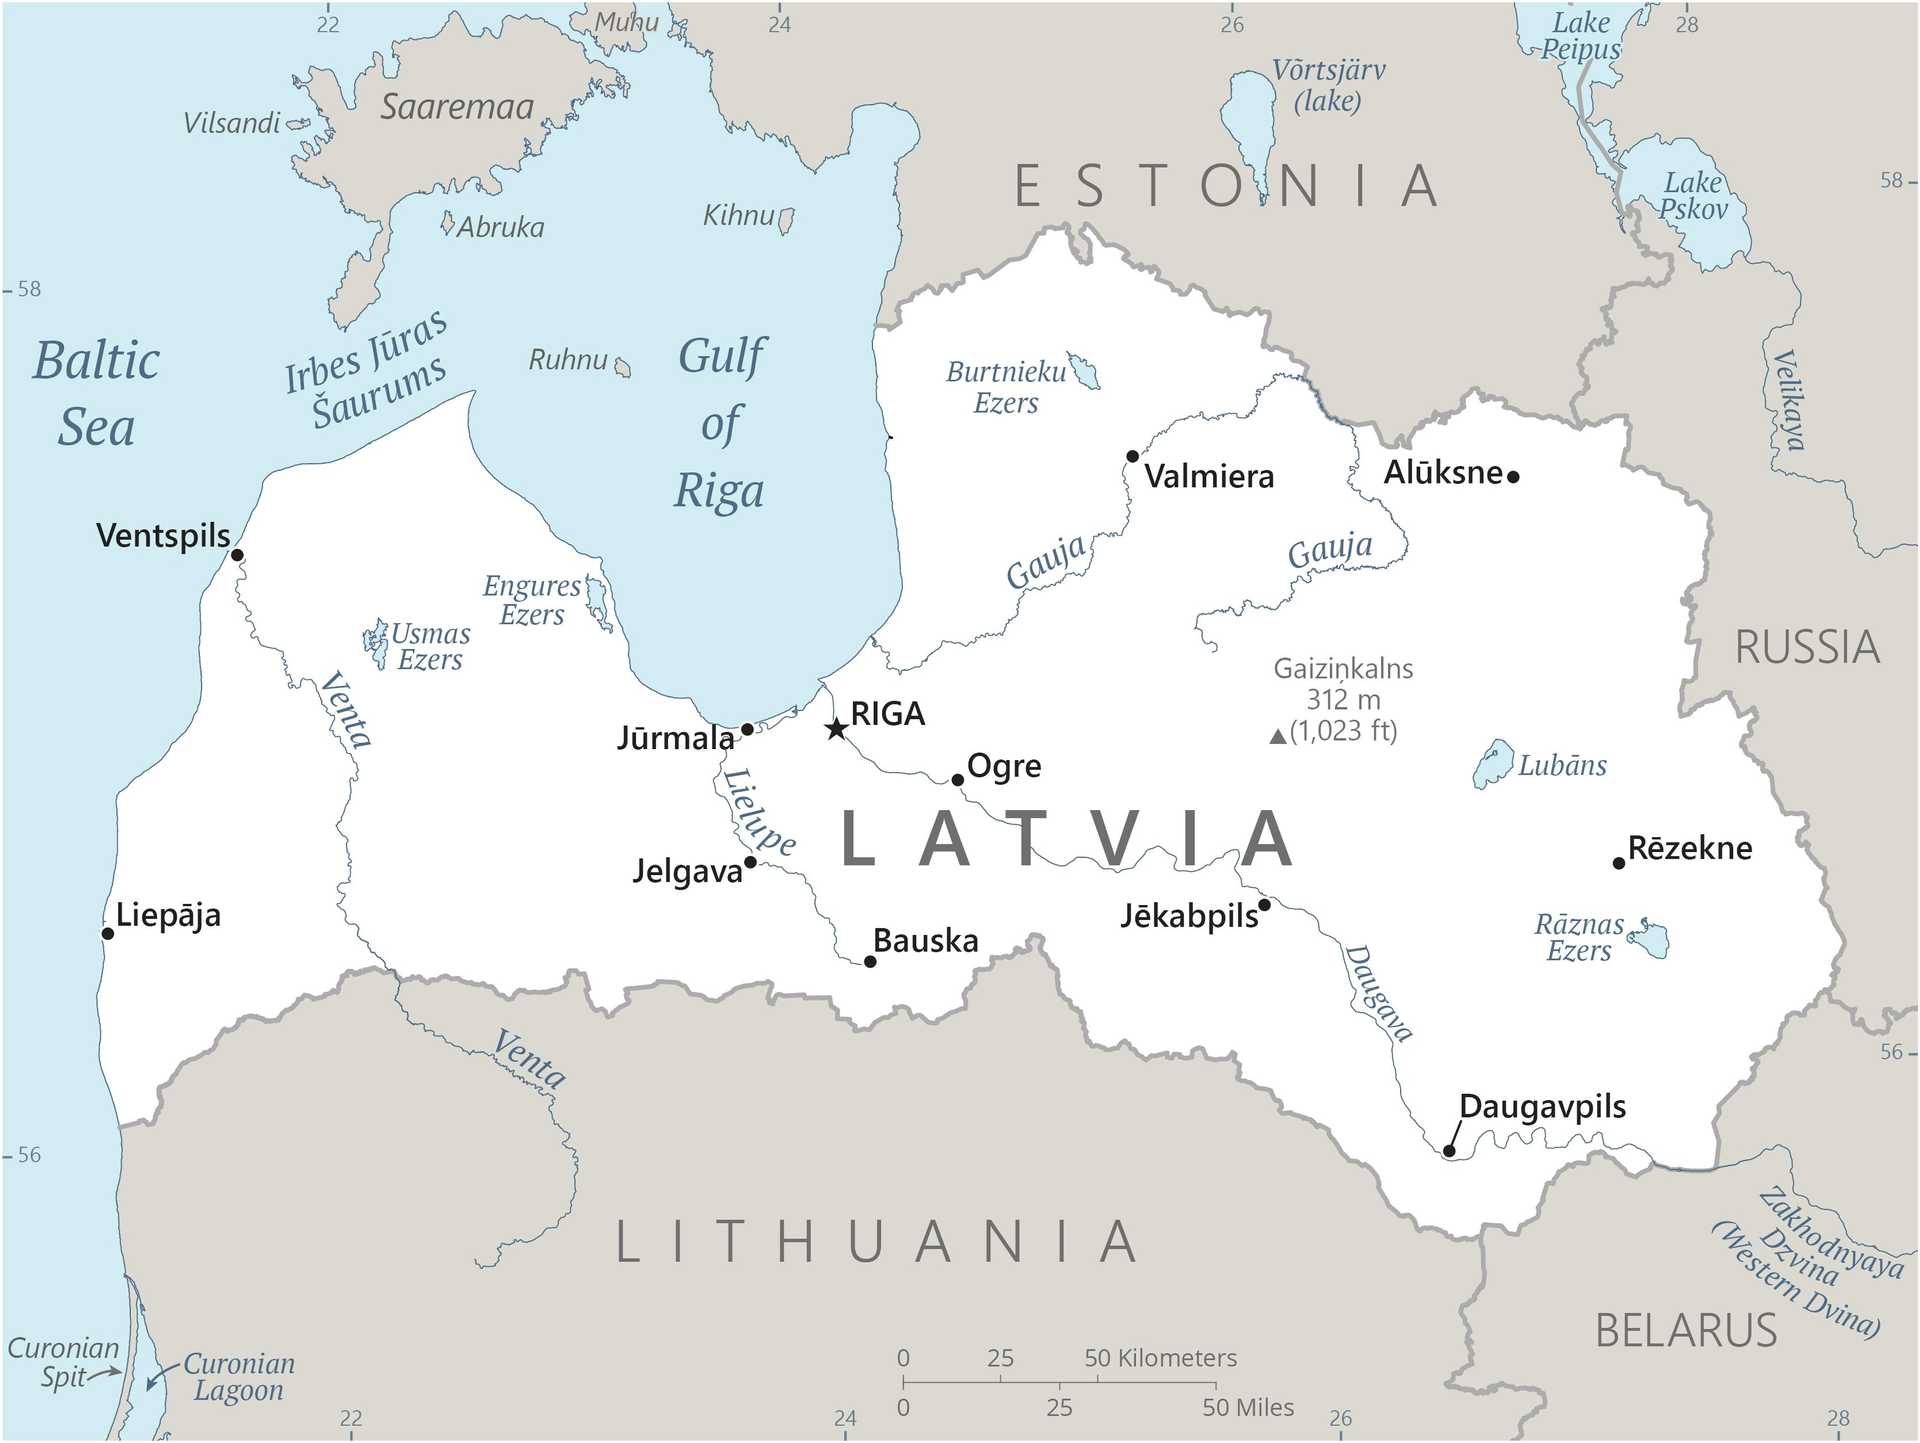
Area
total : 64,589 sq km
land: 62,249 sq km
water: 2,340 sq km
Climate
maritime; wet, moderate winters
Natural resources
peat, limestone, dolomite, amber, hydropower, timber, arable land
People and Society
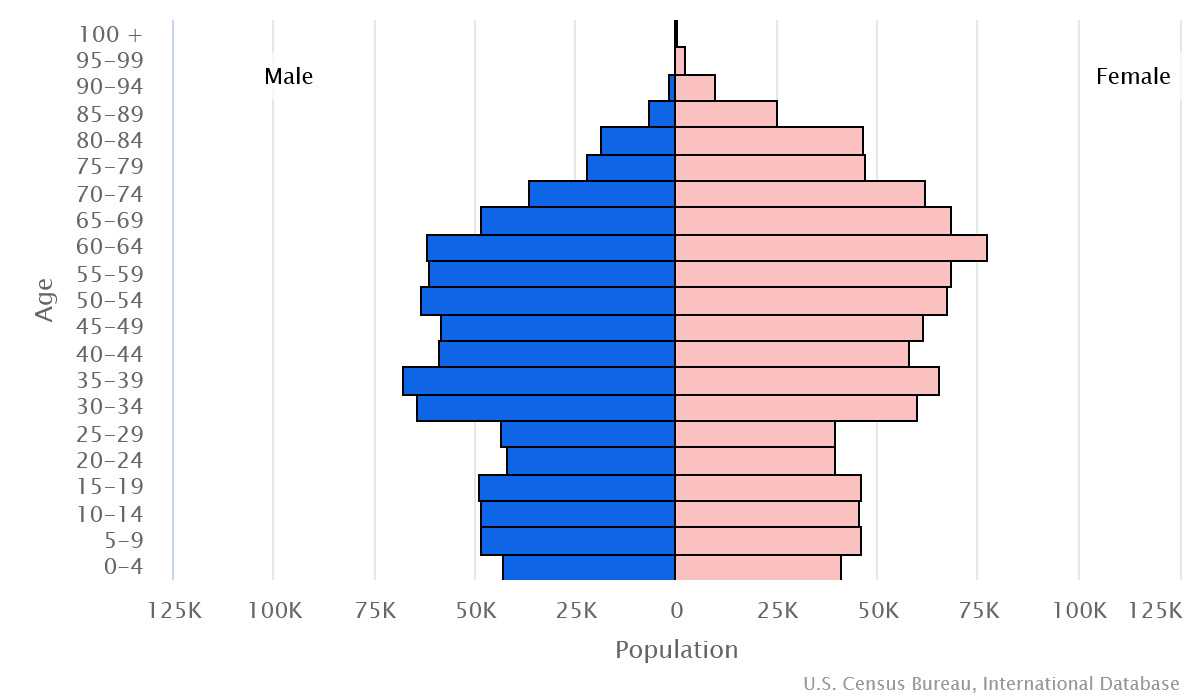
Population
total: 1,801,246
Ethnic groups
Latvian 62.7%, Russian 24.5%, Belarusian 3.1%, Ukrainian 2.2%, Polish 2%, Lithuanian 1.1%, other 1.8%, unspecified 2.6% (2021 est.)
Languages
Latvian (official) 56.3%, Russian 33.8%, other 0.6% (includes Polish, Ukrainian, and Belarusian), unspecified 9.4%; note - data represent language usually spoken at home (2011 est.)
Religions
Lutheran 36.2%, Roman Catholic 19.5%, Orthodox 19.1%, other Christian 1.6%, other 0.1%, unspecified/none 23.5% (2017 est.)
Population growth rate
-1.14% (2024 est.)
Government
Government type
parliamentary republic
Capital
name: Riga
Executive branch
chief of state: President Edgars RINKEVICS (since 8 July 2023)
head of government: Prime Minister Evika SILINA (since 15 September 2023)
Legislative branch
description: unicameral Parliament or Saeima (100 seats; members directly elected in multi-seat constituencies by party-list proportional representation vote; members serve 4-year terms)
Economy
Economic overview
high-income EU and eurozone member; economic contraction triggered by export decline and energy shocks; recovery driven by easing inflation, wage growth, and investments supported by EU funds; challenges from skilled labor shortages, capital market access, large informal sector, and green and digital transitions
Real GDP (purchasing power parity)
$71.154 billion (2023 est.)
$71.355 billion (2022 est.)
$69.308 billion (2021 est.)
Real GDP per capita
$37,800 (2023 est.)
$38,000 (2022 est.)
$36,800 (2021 est.)
Agricultural products
wheat, milk, rapeseed, barley, oats, potatoes, rye, beans, peas, pork (2022)
Industries
processed foods, processed wood products, textiles, processed metals, pharmaceuticals, railroad cars, synthetic fibers, electronics
Exports
$27.947 billion (2023 est.)
$29.374 billion (2022 est.)
$25.43 billion (2021 est.)
Exports - partners
Lithuania 18%, Estonia 10%, Germany 6%, Russia 6%, Sweden 5% (2022)
Exports - commodities
wood, wheat, natural gas, electricity, broadcasting equipment (2022)
Imports
$29.626 billion (2023 est.)
$31.213 billion (2022 est.)
$26.681 billion (2021 est.)
Imports - partners
Lithuania 22%, Estonia 10%, Germany 9%, Poland 9%, Russia 6% (2022)
Imports - commodities
natural gas, refined petroleum, electricity, cars, packaged medicine (2022)
Exchange rates
euros (EUR) per US dollar -
Page last updated: Wednesday, July 24, 2024


