Introduction
Background
Resistance from native Caribs prevented colonization on Saint Vincent until 1719. France and England disputed the island for most of the 18th century, but it was ceded to England in 1783. Between 1960 and 1962, Saint Vincent and the Grenadines was a separate administrative unit of the Federation of the West Indies. Autonomy was granted in 1969 and independence in 1979.
Geography
Area
total : 389 sq km
land: 389 sq km
water: 0 sq km
Climate
tropical; little seasonal temperature variation; rainy season (May to November)
Natural resources
hydropower, arable land
People and Society
Population
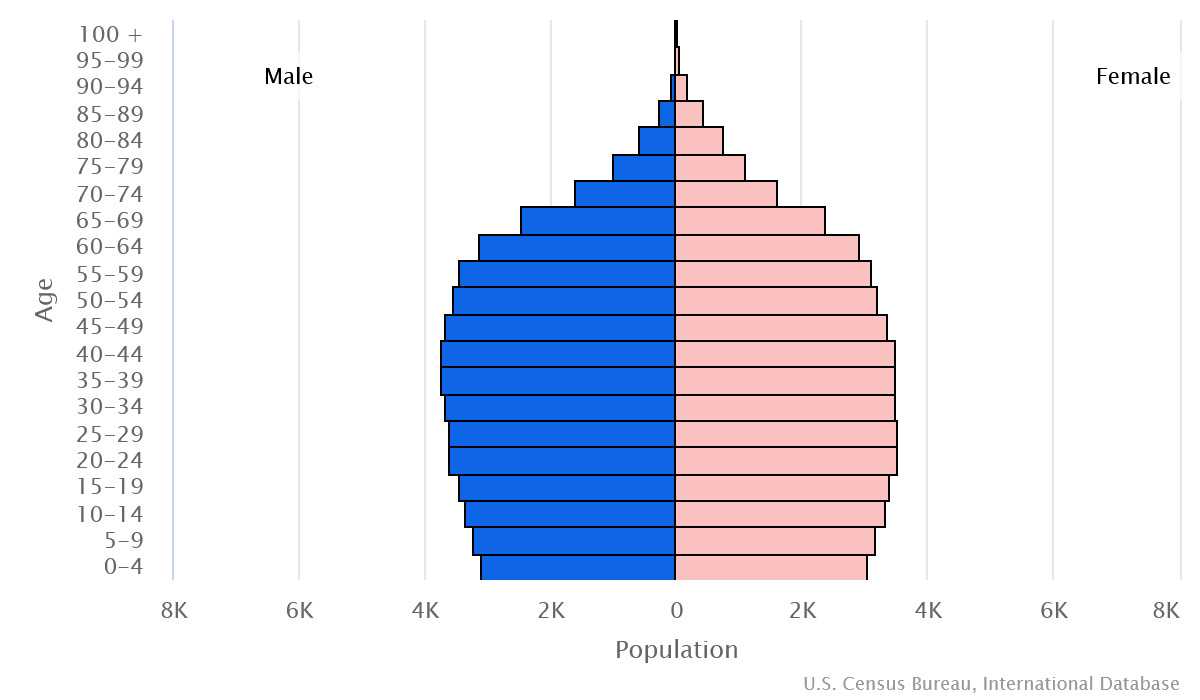
total: 100,647
Ethnic groups
African descent 71.2%, mixed 23%, Indigenous 3%, East Indian/Indian 1.1%, European 1.5%, other 0.2% (2012 est.)
Languages
English, Vincentian Creole English, French patois
Religions
Protestant 75% (Pentecostal 27.6%, Anglican 13.9%, Seventh Day Adventist 11.6%, Baptist 8.9%, Methodist 8.7%, Evangelical 3.8%, Salvation Army 0.3%, Presbyterian/Congregational 0.3%), Roman Catholic 6.3%, Rastafarian 1.1%, Jehovah's Witness 0.8%, other 4.7%, none 7.5%, unspecified 4.7% (2012 est.)
Population growth rate
-0.15% (2024 est.)
Government
Government type
parliamentary democracy under a constitutional monarchy; a Commonwealth realm
Capital
name: Kingstown
Executive branch
chief of state: King CHARLES III (since 8 September 2022); represented by Governor General Susan DOUGAN (since 1 August 2019)
head of government: Prime Minister Ralph E. GONSALVES (since 29 March 2001)
Legislative branch
description: unicameral House of Assembly (23 seats; 15 representatives directly elected in single-seat constituencies by simple majority vote, 6 senators appointed by the governor general, and 2 ex officio members - the speaker of the house and the attorney general; members serve 5-year terms)
Economy
Economic overview
upper middle-income Caribbean island economy; key agriculture and tourism sectors; environmentally fragile; diversifying economy across services, science and knowledge, and creative industries; CARICOM member and US Caribbean Basin Initiative beneficiary
Real GDP (purchasing power parity)
$1.858 billion (2023 est.)
$1.752 billion (2022 est.)
$1.635 billion (2021 est.)
Real GDP per capita
$17,900 (2023 est.)
$16,900 (2022 est.)
$15,700 (2021 est.)
Agricultural products
bananas, root vegetables, plantains, vegetables, fruits, coconuts, mangoes/guavas, yams, spices, sweet potatoes (2022)
Industries
tourism; food processing, cement, furniture, clothing, starch
Exports
$347.827 million (2023 est.)
$278.292 million (2022 est.)
$140.607 million (2021 est.)
Exports - partners
Malaysia 34%, US 10%, Greece 9%, Barbados 8%, Spain 6% (2022)
Exports - commodities
refined petroleum, ships, fish, shellfish, wheat (2022)
Imports
$566.477 million (2023 est.)
$537.929 million (2022 est.)
$425.694 million (2021 est.)
Imports - partners
US 40%, Trinidad and Tobago 10%, China 6%, UK 6%, Turkey 5% (2022)
Imports - commodities
refined petroleum, poultry, ships, raw sugar, plastic products (2022)
Exchange rates
East Caribbean dollars (XCD) per US dollar -
Page last updated: Wednesday, July 24, 2024


