

One of CIA’s oldest and most recognizable intelligence publications, The World Factbook, has sunset. The World Factbook served the Intelligence Community and the general public as a longstanding, one-stop basic reference about countries and communities around the globe. Let’s take a quick look into the history of The World Factbook.
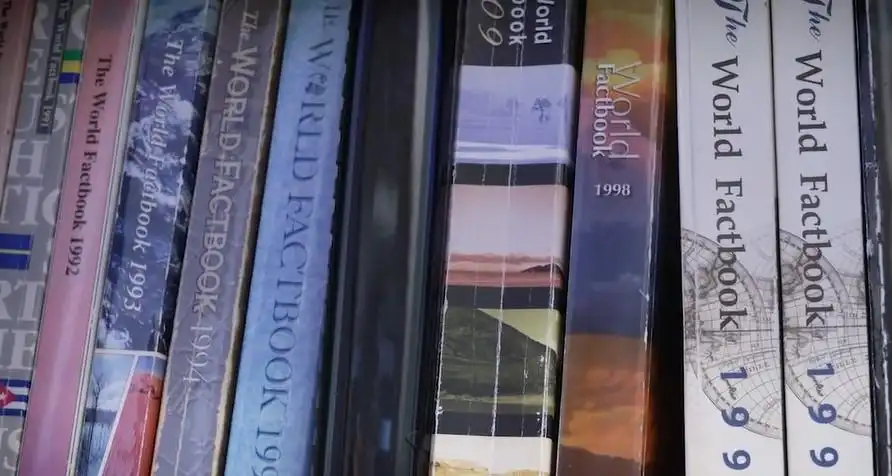
Over many decades, The World Factbook evolved from a classified to unclassified, hardcopy to electronic product that added new categories, and even new global entities. The original classified publication, titled The National Basic Intelligence Factbook, launched in 1962. The first unclassified companion version was issued in 1971. A decade later it was renamed The World Factbook. In 1997, The World Factbook went digital and debuted to a worldwide audience on CIA.gov, where it garnered millions of views each year.
The World Factbook appealed to researchers, news organizations, teachers, students, and international travelers. Some readers even inquired whether their preferred geographic designation or world entity could be included on the high-profile site.
Finally, only CIA insiders would know that officers donated some of their personal travel photos to The World Factbook, which hosted more than 5,000 photographs that were copyright-free for anyone to access and use.
Though the World Factbook is gone, in the spirit of its global reach and legacy, we hope you will stay curious about the world and find ways to explore it… in person or virtually.